Time series has similar patterns. A pattern consists of several segments. Each segment could be represented as a simple parametric regression function. The whole pattern is the sequence of concatenated regression functions.The following information is given: One-dimensional time series and a set of the regression functions. Each function defines:
- type of regression function (linear, exponential, gaussian, etc.);
- parameters of the function;
- minimal and maximal number of samples in the segment;
- maximal value of the variance of the residuals.
One must compute starts of the segments.

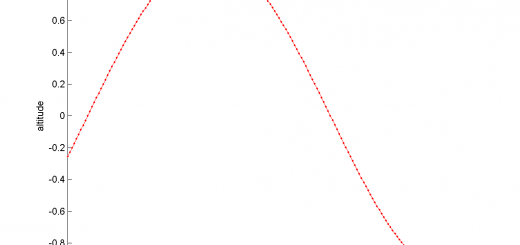
Time series
Mark up the time series
Time series has a pattern. The pattern consists of several segments. Each segment could be represented as a simple parametric regression function. The whole pattern is the sequence of concatenated regression models. The following information is given:
1) One-dimensional time series and 2) a set of regression models. Each model defines: – the type of regression function (linear, exponential, gaussian, etc.); – the parameters of the function; – the minimal and maximal number of samples in the segment; – the maximal value of the variance of the residuals.
One must compute the starts of the segments. Note that there is – no gap between the segments; – there could be any gap between patterns; – segments may vary in length; – there are broken, unknown, etc., patterns. The main problem is defining the optimal segment start point between two neighbor segments.
The principle of the algorithm: 1) There is the regression function ‘any’ for each pattern to begin with. 2) The 1-st point (start of the segment) is the point between ‘any’ and the 1st segment of the pattern. 3) Continue for each segment’s pair of patterns.
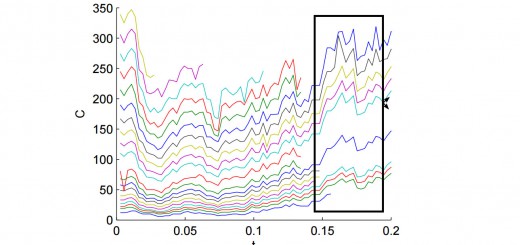
How to find the point? Since each segment could vary its length from min to max, assume the Cartesian product of the length of both segments – antecedent and consequent. For each pair of segments, calculate the sum of variances of the segment residuals. The minimal variance defines the length of the segments and, so, the point between them.
Contents
Load the time series
x = dlmread('xMarkUp.csv');
%x(1:1500) = [];
figure; hold on
plot(1:length(x),x,'g.');
axis tight
xlabel time
ylabel value
title('The time series to mark up');

Define regression functions for segments
It is a structure array with the following fields:
The dummy segment (for any possible gap between patterns)
mark(1).func    = 'mark_any';   % function name, the function must be in the Matlab path
mark(1).w       = [];           % regression function parameters (there are no parameters for this function
mark(1).tmin    = 0;            % minimal length of the segment
mark(1).tmax    = 100;          % maximal length of the segment
                                % NOTE! set the value no more than the length of the pattern
mark(1).err = 0.1e-6;           % maximal variance of the regression residuals (0.1e-6 for this function)
% The 1st segment
mark(2).func    = 'mark_anylin';
mark(2).w       = 10.818;
mark(2).tmin    = 9;  %10;
mark(2).tmax    = 12; %15;
mark(2).err     = 5;
% The 2nd segment
mark(3).func    = 'mark_const'; % the first constant
mark(3).w       = 150; %
mark(3).tmin    = 28;
mark(3).tmax    = 36;% 32 GD100;%
mark(3).err     = 5;
% The 3rd segment
mark(4).func    = 'mark_anylin';
mark(4).w       = 4.9548;
mark(4).tmin    = 36;%24;
mark(4).tmax    = 44;%46;
mark(4).err     = 12;
% The 4rh segment
mark(5).func    = 'mark_anyconst'; % the second constant
mark(5).w       = [];
mark(5).tmin    = 40; %62 GD100; % 40 ONLY for IPOH
mark(5).tmax    = 68;%80
mark(5).err     = 8;
% The 5th (last) segment
mark(6).func    = 'mark_anyexp';
mark(6).w       = [298.7405   -0.0574]; %
mark(6).tmin    = 80;
mark(6).tmax    = 80;
mark(6).err     = 7;
Discussion
The regression parameters are defined manually. There are two ways to get mark the segment: 1) check the variance of the residuals
2) check the regression parameters have acceptable values. We chose the 1st way. Below we define each segment manually and estimate its possible length and parameters.
Find the parameters of the 1-st segment, line
ptr_list = [0
            255
            255+12+1
            255+12+39+1
            255+12+39+30+1
            255+12+39+30+60+1
            ]; % Define starts of each segment

% 1) Observe the segments one-by-one
for segNum = [2 3 4 5 6] %
    % 2) Set the start of the segment manually
    ptr = ptr_list(segNum);
    fprintf(1,'\nSegment %d\n', segNum-1);

    % 3) Calculate parameters and variance for each length
    vecErr = []; % vector of segment variances
    matW = [];    % matrix of segment parameters
    figure; hold on

    for timRelative = mark(segNum).tmin  : mark(segNum).tmax
        tim = [ptr:ptr+timRelative]';  % time ticks of the segment
        seg = x(tim);               % segment values
        % 4) Get the parameters and variance
        [y, err, w] = feval(mark(segNum).func, mark(segNum).w, seg);
        vecErr = [vecErr; err];
        matW =  [ matW;, w];
        % 5) Use the parameters to show possible variances for each segment length
        %[y, vecSig2(end+1) ] = feval(mark(segNum).func, mark(segNum).w, x(ptr:ptr+ti));
        % 6) Plot the result
        %subplot(5,1,segNum-1); hold on
        plot(tim, seg, 'b.');
        plot(tim, y, 'r-');
        xlabel('time'); ylabel('value');
        title(['Segment ', num2str(segNum-1)]);
        fprintf(1, '    len = %d, err = %0.2f,             w = %s\n',  timRelative, err, num2str(w));
end
end
Segment 1
    len = 9, err = 0.80,             w = 10.6424
    len = 10, err = 1.06,             w = 10.5091
    len = 11, err = 2.30,             w = 10.1818
    len = 12, err = 4.05,             w = 9.7143

Segment 2
    len = 28, err = 1.34,             w = 150
    len = 29, err = 1.32,             w = 150
    len = 30, err = 1.30,             w = 150
    len = 31, err = 1.27,             w = 150
    len = 32, err = 1.26,             w = 150
    len = 33, err = 1.24,             w = 150
    len = 34, err = 1.22,             w = 150
    len = 35, err = 1.20,             w = 150
    len = 36, err = 1.19,             w = 150

Segment 3
    len = 36, err = 5.83,             w = 4.5737
    len = 37, err = 6.83,             w = 4.4762
    len = 38, err = 7.82,             w = 4.3757
    len = 39, err = 8.93,             w = 4.2662
    len = 40, err = 9.82,             w = 4.1641
    len = 41, err = 10.71,             w = 4.0621
    len = 42, err = 11.68,             w = 3.9544
    len = 43, err = 12.48,             w = 3.8548
    len = 44, err = 13.25,             w = 3.7568

Segment 4
    len = 40, err = 0.62,             w =
    len = 41, err = 0.62,             w =
    len = 42, err = 0.61,             w =
    len = 43, err = 0.60,             w =
    len = 44, err = 0.60,             w =
    len = 45, err = 0.59,             w =
    len = 46, err = 0.58,             w =
    len = 47, err = 0.58,             w =
    len = 48, err = 0.57,             w =
    len = 49, err = 0.57,             w =
    len = 50, err = 0.56,             w =
    len = 51, err = 0.55,             w =
    len = 52, err = 0.55,             w =
    len = 53, err = 0.54,             w =
    len = 54, err = 0.54,             w =
    len = 55, err = 0.53,             w =
    len = 56, err = 0.53,             w =
    len = 57, err = 0.53,             w =
    len = 58, err = 0.52,             w =
    len = 59, err = 0.52,             w =
    len = 60, err = 0.57,             w =
    len = 61, err = 0.95,             w =
    len = 62, err = 2.23,             w =
    len = 63, err = 4.14,             w =
    len = 64, err = 6.44,             w =
    len = 65, err = 9.05,             w =
    len = 66, err = 11.75,             w =
    len = 67, err = 14.71,             w =
    len = 68, err = 17.76,             w =

Segment 5
    len = 80, err = 3.01,             w = 298.9107   -0.05706107


The main mark up function
[patterns, err] = markup(mark, x, 1);
%[patterns, err, params] = markup(mark, x);
Plot the result of the marking with the fixed regression parameters
figure; hold on
plot(1:length(x),x,'g.');
axis tight
yminmax = ylim;
colors = {'r','b','y','c','m'};
for segTimeNaN = patterns'
    segTime = segTimeNaN(find (~isnan(segTimeNaN)) );
for segNum = 1:length(segTime)-1
        tim = [segTime(segNum) : segTime(segNum+1) - 1]'; %NOTE minus one
        seg = x(tim);
        [segY, seg1sig] = feval(mark(segNum+1).func, mark(segNum+1).w, seg);  % calculate the variance (fitness)
        plot(tim, seg, [colors{segNum},'.']);
        plot(tim, segY, [colors{segNum},'-']);
end
end
xlabel time
ylabel value
title('All patterns, including the broken ones');

Plot only correct patterns
[patterns, err] = markup(mark, x);
figure; hold on
plot(1:length(x),x,'g.');
axis tight
yminmax = ylim;
colors = {'r','b','y','c','m'};
for segTimeNaN = patterns'
    if ~any(isnan(segTimeNaN))
        segTime = segTimeNaN;
        for segNum = 1:length(segTime)-1
            tim = [segTime(segNum) : segTime(segNum+1) - 1]'; %NOTE minus one
            seg = x(tim);
            [segY, seg1sig, w] = feval(mark(segNum+1).func, mark(segNum+1).w, seg);  % calculate the variance (fitness)
            plot(tim, seg, [colors{segNum},'.']);
            plot(tim, segY, [colors{segNum},'-']);
end
end
end
xlabel time
ylabel value
title('There is only one correct pattern in the time series');
Appendix: library of the regression functions
now three functions are suggested: mark_any, mark_lin, mark_exp The example of mark_exp:
% function [y, mse, w] = mark_exp(w, x)
% % [idx, w, sig2] = mark_exp(x, t, w, sig2)
% % mark time series x, the exponential function
% %
% % w [1,W] parameters of the model here y = w(1) + w(2)*x;
% % x [m,1] time series, the depended variable of the regression fit
% %
% % y [m,1] the calculated depended variable
% % mse [scalar] the residual variance, MSE
% % w [1,W] parameters of the function
% %
% % if the regression parameters are required, the Levenberg_Markquardt Method will
% % be called, and the parameters will be returned together with new MSE.
%
% % Example
% % x = [298; 294; 284; 272; 260; 248; 238; 226; 216; 206; 196; 186; 178; 170; 162; 154; 148; 140; 134; 128; 122; 118; 112; 108; 102;  98;  94;  90;  88;  84;  80;  78;  76;  72;  70;  68;  66;  64;  62;  60;  58;  56;  56;  54;  54;  52;  50;  50;  48;  48;  48;  46;  46;  46;  46;  44;  44;  44;  44;  42;  42;  42;  42;  42;  40;  40;  40;  40;  40;  40;  40;  40;  38;  38;  38;  38;  38;  38;  38;  38;  38;  38;  38;  38;  38;  38;  38;  38;  38;  38;  38];
% % w = [[30 300 -0.05]]
% % [y1, sig2] = mark_exp(w, x)
% % [y2, sig2, w] = mark_exp(w, x)
% % tim = [1:length(x)]';
% % figure; hold on
% % plot(tim, x, 'k.');
% % plot(tim, y1, 'b-');
% % plot(tim, y2, 'r-');
% % legend('source', 'manual parameters', 'optimised parameters');
% % xlabel('time'); ylabel('value');
%
% f = inline('w(1) + w(2) * exp(w(3) * (1:length(x))'')', 'w', 'x');
% if nargout > 2
%     w = nlinfit((1:length(x))', x, f, w);
% end
% y = f(w,x);
% mse = var(x-y);
% return
Tags: time series analysis, time series data, time series forecasting, time series forecasting python, time series model, multivariate time series, time series in statistics, time series analysis python, time series data examples, multivariate time series forecasting, time series python, time series machine learning, define time series, time series analysis and its applications, time series data analysis, time series forecasting models, time series analysis forecasting, time series forecasting in python, time series analysis example, time series analysis in statistics, time series meaning, time series forecasting machine learning, time series example, introduction to time series and forecasting, machine learning forecasting, time series analysis and forecasting