Use one of the following data samples to show the forecast
Contents
file: demo_ssa_forecast
1) electricity consumption
x = [0.1925 0.2059 0.2731 0.4828 0.7077 0.9331 1.0521 1.0980 1.1000 1.0424 0.9528 0.9129 0.9097 0.8249 0.7598 0.7562 0.7005 0.7156 0.8270 0.8471 0.5891 0.3213 0.1987 0.1732 0.1466 0.1635 0.1892 0.3744 0.5850 0.7753 0.8808 0.9656 0.9297 0.8573 0.8851 0.8724 0.8489 0.8242 0.7763 0.7158 0.6584 0.6521 0.8567 0.8930 0.6392 0.3693 0.2284 0.1793 0.1726 0.1695 0.2098 0.4510 0.6292 0.8091 0.9150 0.9644 0.9509 0.9200 0.9153 0.8913 0.9090 0.9308 0.8675 0.7714 0.6928 0.7089 0.8377 0.8639 0.5720 0.3275 0.1999 0.1613 0.1352 0.1041 0.1456 0.3835 0.6100 0.7426 0.8700 0.9062 0.8766 0.8698 0.9330 0.9349 0.9033 0.8457 0.7573 0.6992 0.6422 0.6323 0.8158 0.8855 0.6103 0.3356 0.2118 0.1000]';
t = [733470 + 0.0417 *(1:length(x))]';
K = 24;   % period
M = 24*3; % forecast horizon

2) triangle example
% x = [1 2 3 2 1 2 3 2 1 2 3]';
% t = [1:length(x)]';
% K = 3;
% M = 6;

3) trapezoid example
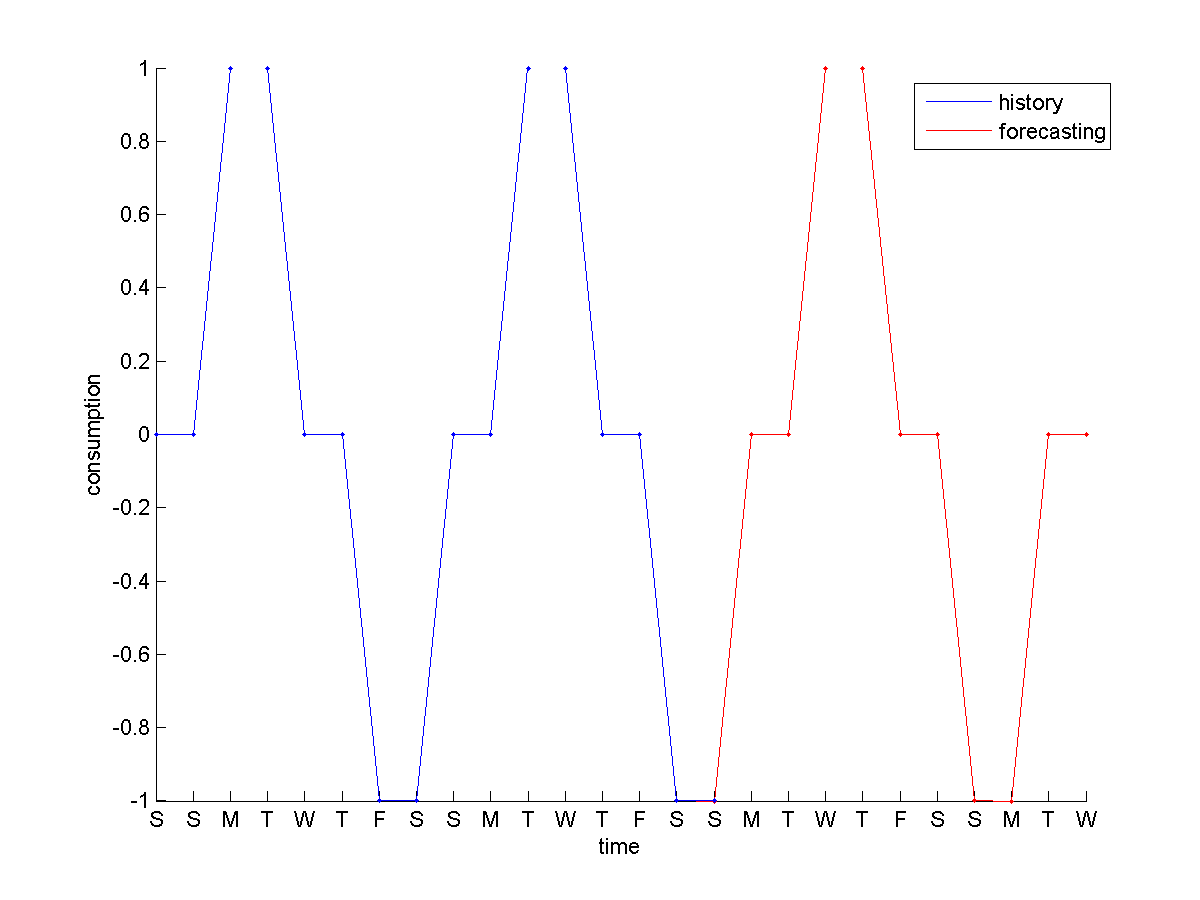
% x = [0 0 1 1 0 0 -1 -1 0 0 1 1 0 0 -1 -1]';
% t = [1:length(x)]';
% K = 8;
% M = 10;


4) sine example
% t = linspace(-2*pi,2*pi, 160)';
% x = sin(t) + sin(4*t);
% K = 10;
% M = 120;

run the forecasting algorithm
x1 = ssaMtick(x,M,K); % see comments in the code
show the results
h=figure; hold('on');
t = [t; t(end)+((t(2)-t(1))*[1:M]')];
x = [x; NaN*ones(M,1)];
plot(t',x, 'b-');
plot(t',x1,'r-');
plot(t',x1,'r.');
plot(t',x, 'b.');
plot(t',x, 'b-');
legend('history', 'forecasting');
datetick('x','d')
ylabel('consumption');
xlabel('time');
axis tight
hold off
%saveas(h,'img/ssa_frc_consum.png','png');
close(h);
% end


