Introduction
There are lots of ways to construct indices. However, when algorithms are chosen and some results obtained, the following question arises:
– How to show adequacy of the calculated indices?
To answer the question analysts invite experts. The experts express their opinion and then the second question arises:
– How to show that expert estimations are valid?
There is a technique that produces valid indices based on measurement data and expert estimates.
Note: general information about indexing techniques one can find in the:
1. Aivasian S. A, Mkhitarian V. S. Applied statistics and essential econometrics. Moscow, UNITI, 1998.
2. Litvak B. G. Expert information: methods for reception and analysis. Moscow, RIS, 1982.
Problem
Let us consider comparable objects, for example nature protected areas.
- Dark Creek
- Wild Glade
- Forestlet
- Wide Steppe
- Joyful
One has to make an index to each object. In the other words, to make object rating based on feature descriptions of the objects and considering estimates made by the experts.
A criterion to compare the objects is also called as index descriptor. Let us observe the criterion of “management effectiveness in nature protected areas”.
Solution: step1. Basic features collection
The first thing to do is to make a list of the features that help to form the object index. An optimal value must be assigned to each feature. It is necessary to eliminate the feature measurement units and covert features to unified scale. An ideal object has all its features optimal.
The features of the protected areas management effectiveness are:

How to know that list of basic features is complete? We assume that if the list is complete then any additional feature has negligible influence on the index. That is to say the condition “all the rest are equal” is fair.
If the list of basic features is very long or if there is no way to make the list then we have to split groups so that grouped objects became comparable. Anyway, the indices are valid when all the objects are comparable.
Step 2. Data acquisition
The necessary information for each object is collected and then the data is wrote to united table. We will no get into details of the measuring techniques and expert assessments methods since it is a separate complex problem. The results is the table:

The table data will be converted to unified, or standard data.
Step 3. Preliminary analysis
The preliminary analysis answers the questions:
- What data are necessary and what data are needless?
- What technique of the index making we have to choose?
The preliminary analysis reports on:
- data quality estimation,
- basic features list validation,
- the index, preliminary version.
Step 4. The first result: index and short report
To make the index with no expert participation, we have to use different techniques. In the given example the Principle Components method was used. The table shows indices of protected areas management effectiveness.
It is easy to note that “Joyful” area gets the highest index and so, it is the best area. The “Dark Creek” terminates the list.
 |
 |
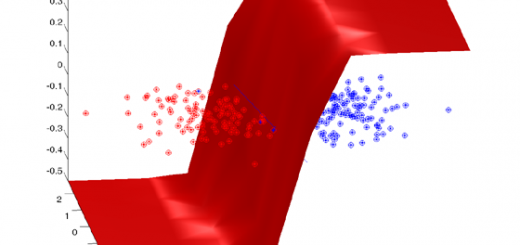
The plot shows the method idea: the new coordinates were found so that sum of vector components variance is maximal. Here vectors are object feature descriptions. The line on the plot shows a Principle Component projection to a flat where X-axis is “Fines collected” and Y-axis is “Science research financing”.
Note. The formula of the protected areas management effectiveness index is
qi = w1xi1+w2xi2+…+w5xi5.
Where qi — i-th object index,
w1…w5 — weights of feature significance,
xi1…xi5 — measure data for i-th object.
Step 5. Expert estimations for the objects
To validate the obtained result we have experts to take part in the project. The experts, that have independent opinion about the object indices or the rating, make their estimations. We can verify the expert estimations, for example, using the pair-vise comparison matrix. There are the other ways to verify or specify the expert estimations or even calculate the common expert estimations for an expert group.
The table shows that the expert assessments of the objects and obtained indices are not the same.
Step 6. The expert estimations validation
We can try to find the reason an expert makes his estimations for: change the weights of the feature significance so that get the same expert estimations by the calculation way. The principle is: “Tell me how do you estimate the object and I tell you what do you estimate the object for”. The calculation shows that experts make that the most significant feature is “Fines collected” and the less significant is “Science research financing”.
Like to the step 5, we ask the experts to put the feature significance weights.
Step 7. Expert estimations concordance
We have
- table of the object data,
- object indices,
- expert estimations for the objects,
- calculated weights of the feature significances,
- expert estimations of the feature significances.
Dilemma
- The calculated indices are not the same as the expert estimations for the objects.
- As well, the calculated weights of the feature significances are not the same as the expert estimations of the feature significances.
There is a technique to make indices by way of expert estimations and measure data concordance. The technique allows us to modify indices and weights until we have valid estimations.
Practical example
To validate indices we have the pectoral expert estimations and impersonal data to concord.
The index calculator allows make such indices. The stat values of the indices and weights are set as a Principal Components method result. You can set the object and weight of feature significances estimations. To make the indices you have to choose what the estimations are preferable: object estimations of weights of feature significances estimations. To make the choice one has to use the importance bar.
Conclusion
- We have the indices (ratings) for the objects: validated and not contradicted to the real data.
- We have weights of the features to make indices with no expert involving in the future.
- The measured data and expert opinions are analyzed.
The index making consist of the next steps:
- collecting the list of basic features,
- assigning optimal values of features,
- making the united table,
- preliminary analysis, index: preliminary version,
- expert estimations of objects and features/li>
- validation of the expert estimations,
- concordance of the expert estimations.
How to make the index
Let us consider a set of objects. One has to compare objects to know what objects are better and what objects are worse. The result of the comparison is a rating of the objects. That is a list of objects sorted according to their quality, or the result is an index set where each index points to each object’ quality. Index or integral indicator is a general characteristic of an object (value of object’ quality, effectiveness, or preference). Usually index is a positive number that is calculated by means of mathematical methods, or models and description of the objects.
To construct an index one has to collect data about the every object. For that purpose one needs to assume a set of features that describe the objects according to some criteria. A criterion exposes principle that joins all the features and shows the goal of index making. After data acquisition we have a table “object-feature” where the rows represent objects and columns represents features.
Using the table we can make the required index. For that one chooses one of mathematical methods such as Singular Components, Principle Components, Pareto Slicing and the others. The methods form index as precise (linear) estimations, object ordering (rating) or rough or linguistics estimations. The mentioned methods also called as “non-expert” methods.
Often experts that have their own opinions in particular applications want to assign indices or expert estimations. There are three types of the estimations. First, an expert can compare objects or say what object are better and what object are worse. Second, the expert can assign the estimations in the convenient scale that is to say more precise than previous case. That is so called ranking. Third, the expert can set the estimations with high precision degree. Such estimations are called linear-scaled.
Expert estimations can prove or disprove the indices that were results of “non-expert” methods. There is a reason to compare these two results: objects’ expert estimations and indices and correct or specify them. Such correction or specification composes expert estimations concordance technique.
Like the object’ estimation procedure, the expert can assign feature significance weights. Using the weights and measured data we can compute the objects’ indices. And vice versus: using the objects’ estimations and data we can compute weights. The proposed technique solve problem is to concord expert estimations, indices and weights.
As a result we have: first, precise valid indices. Second, we have the reasoned expert estimations; we know why expert valued an object and what contribution a feature makes to index. And we have weights to make future indices by using “non-expert” methods.
The methods with or without expert involvement were used for solution different economical, sociological and ecological problems. Here are some of them.
1. Russian nature protected areas management effectiveness evaluation. Annually, all the state nature protected areas make report on main activities: reservation, science, educational. There are 101 nature-protected areas in Russia and report contents 139 features. To check report adequacy the experts were involved. The experts point to more important features and estimates integral indicators. The adequate, for the expert opinion, indices were computed.
2. Integral indicator for quality of life in Russian regions. The State Statistics Committee collects data for 76 Russian regions to make hierarchic integral indicator. The indicator included wealth rate, people quality, public health service quality and ecology potential for each region. The integral indicator is based on more than 80 features.
3. Human Development Index in Russia was developed according to UNO development program. Using an expert who assigned the human development index order for each of 73 regions, the index model was reconstructed and feature weights were founded.
4. Kyoto-index is indented to evaluate ecological footprints of power plants. The index was based on an expert model and was used for model assessment of Ohio power plants, USA. Kyoto-index also is a measure of any industrial system ecological footprint.
Expert-statistical technique overview
The indexing technique is based on data reduction method and expert-statistical method. The term was introduced by S. A. Aivazian in 1974:
“When we are trying to estimate, in general, production effectiveness of a separate employee, a division or an enterprise (for example, estimation criteria can be quality of live, development index), estimate quality of a sportsman or sporting team in game sports, every time we solve (often intuitional) the same problem: taking as a initial condition a set of separate features, where each feature can be measured and describe a separate part of effectiveness criteria, we assigning weights of a feature significance (the weight of feature influence on general aggregate effectiveness conception) and so we have some scalar, general effectiveness index.”
Hereby idea to construct an index, or integral indicator, for a set of objects as a linear combination of the object feature descriptions was proposed.
Also we can list methods for index making such as Principle Components, Factor Analysis, Extreme Feature Grouping, Multidimensional Scaling, Maximal Informative Features Selection, et cetera. The methods use a measured description of objects as information for indexing. Also there are methods that use expert estimations: Pair-wise Comparison, Fussy Relations and Linguistic Scaling.
In the other hand, V. V. Shakin in 1972 introduced a method for jury estimations objectification. The main principle of the method is in duality of expert estimations: experts can estimate both quality of objects and feature significance weights. The proposed method develops that principle to the expert estimations concordance technique.
So there are three ways to construct an index. The first is to make index with a method that used measured data with no expert estimations. The second is to make index where experts estimate the feature significance weights. Both methods use feature linear combination for measured data to make the index.
Unlike all the mentioned methods the expert estimations concordance technique uses as measures data as well expert estimations of object quality and feature significance weights. According to the technique the experts extricate the contradictions between measured data and expert estimation.
Experts play important role in the indexing. Experts set an index criteria, approve the set of comparable objects, observe set of feature descriptions, put estimations. We assume that an expert that takes part in index has his own opinion and the opinion is not biased by public opinion. The expert opinion must result the expert experience and skills. Experts put their opinions and estimations to specially prepared questionnaires. All the questionnaires were created to give experts maximal freedom in expression.
As the result of the expert estimations concordance technique application we have validated indexes. Also we have the reasoned expert estimations and feature weights to make indexes in future with no expert involvement.
About the services and the author
If you would like us to
- make indices to a set of objects, or to an object in dynamics,
- analyse or mine data, write reports on data,
- create non-biased questionnaires to collect expert estimations,
- consult or maintain complex projects on index making,
please, do not hesitate to send an e-mail to the author.
Author – Vadim V. Strijov,
The author took part in the following projects on indices making.
- Integral indicators of the quality of life in Russian regions
- Human development index in Russia
- Kyoto-index: power plant ecological footprints in the USA, Ohio
- Protected area management effectiveness is Russia
- Index of rare and Red List species in Russia
- Ill-data from the former USSR processing
- Econometrical index of the Russian economy state
- The high school science effectiveness for the Ministry of Education